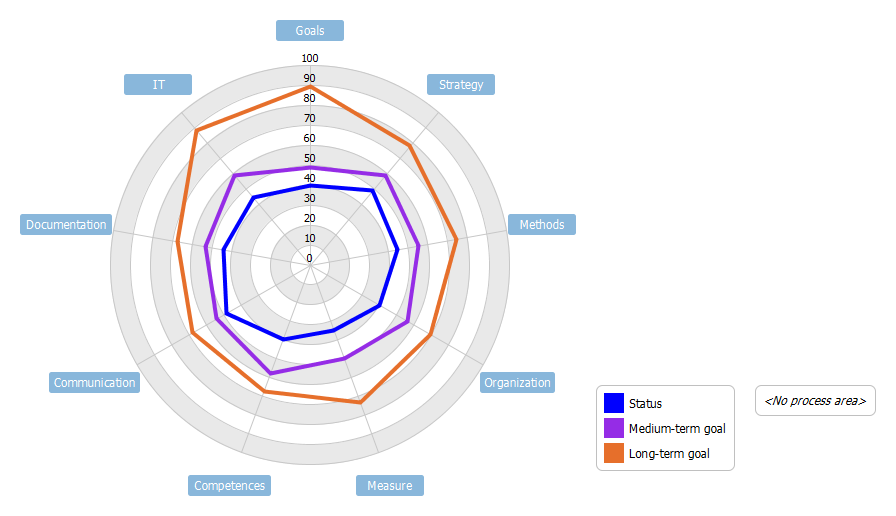
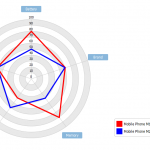
Radar Chart Example - Radar Chart, also known as spider chart, is a way of comparing multiple quantitative variables. This makes them useful for seeing which variables have similar values or if there are any outliers amongst each variable. Radar Charts are also useful for seeing which variables are scoring high or low within a dataset, making them ideal for displaying performance.
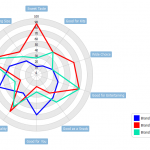
The example consists of nine categories: goals, strategy, methods, organizing, evaluation, competencies, communication, documentation and IT. The five maturity levels range from "chaotic" (level 0) to "sustainable" (level 5) summarizing the result of the evaluation process together with medium- and long-term goals.